Chapter 8 1) Introduction
In this application, we explore the capabilities of a stochastic approach based on a machine learning (ML) algorithm to elaborate landslides susceptibility mapping in Canton Vaud, Switzerland. Generally speaking, ML includes a class of algorithms for the analysis, modelling, and visualization of environmental data and it performs particularly well to model environmental hazards, which naturally have a complex and non-linear behavior. Here we use Random Forest, an ensemble ML algorithm based on decision trees.
8.1 1.1) The main objective
Landslides are one of the major hazard occurring around the world. In Switzerland, landslides cause damages to infrastructures and sometimes threaten human lives. Shallow landslides are triggered by intense rainfalls. Such slope movements are generally very rapid and hardly predictable. Different quantitative approaches have been developed to assess the most susceptible areas.
This project applies a data-driven methodology based on Random Forest (RF) (Leo Breiman10) to elaborate the landslides susceptibility map of canton of Vaud, in Switzerland. RF is applied to a set of independent variables (i.e., the predictors) and dependent variables (the inventoried landslides and an equal number of locations for absences). The overall methodology is described in the following graphic ().
8.2 1.2) The overall methodology
The methodological overview is described in the following graphic: .
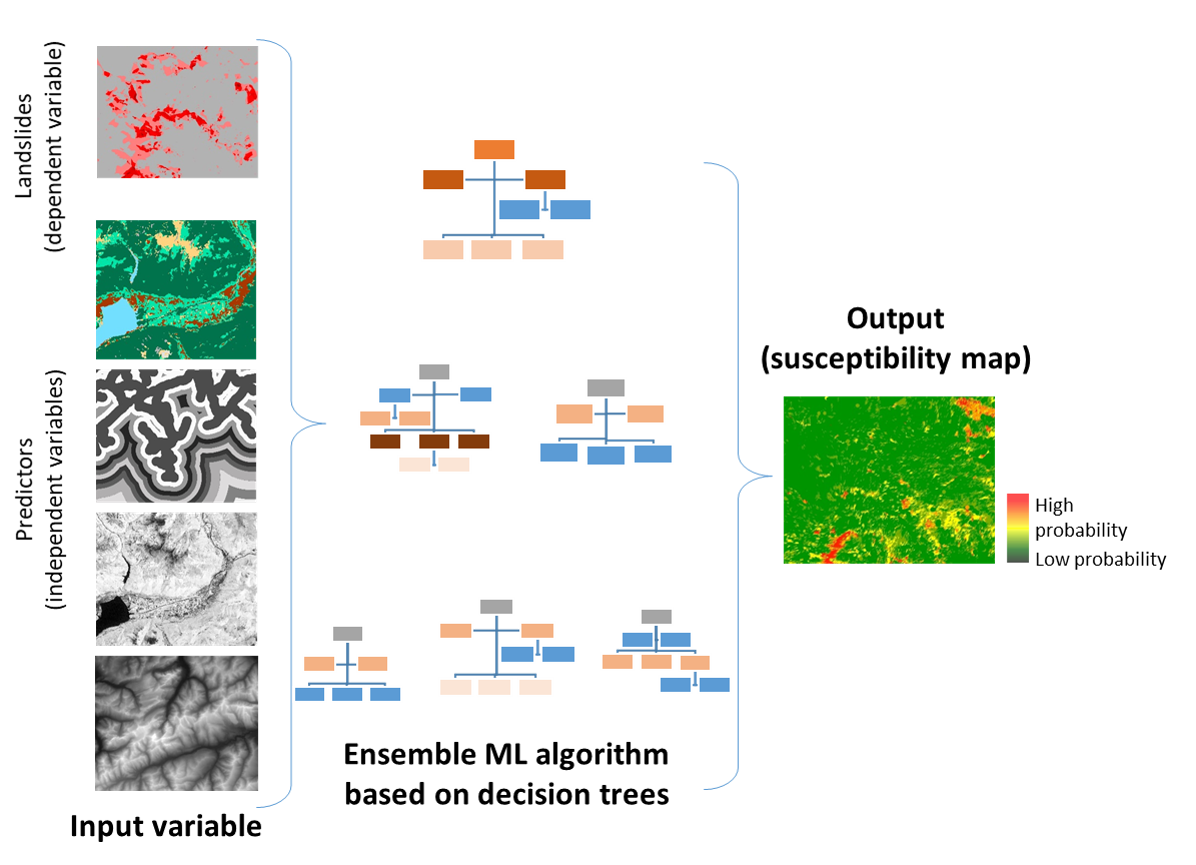
Figure 8.1: Basic elements of the generic methodology
8.3 1.3) Load libraries
To perform the analysis, you have first to install the following libraries:
library(terra): Methods for spatial data analysis with vector (points, lines, polygons) and raster (grid) data.
library(sp): Classes and methods for spatial data.
library(readr): The goal of ‘readr’ is to provide a fast and friendly way to read rectangular data (like ‘csv’, ‘tsv’, and ‘fwf’).
library(randomForest): Classification and regression based on a forest of trees using random inputs, based on Breiman (2001) doi:10.1023/A:1010933404324.
library(dplyr): It is the next iteration of plyr, focused on tools for working with data frames (hence the d in the name).
library(pROC): Allowing to compute, analyze ROC curves, and
- library(plotROC) to display ROC curve
(ggplot2): Is a system for declaratively creating graphics.
List of the loaded libraries
##  [1] "plotROC"      "ggplot2"      "pROC"         "dplyr"        "randomForest"
##  [6] "readr"        "terra"        "distill"      "stats"        "graphics"
## [11] "grDevices"    "utils"        "datasets"     "methods"      "base"